Today a lot of corporations have a lot of Data, which is the new oil in the modern world. The question is what to do with this oil? Oil needs a refinery so it can be created into further products. Similar to oil, data needs to be transformed and cleaned before its usage. For that purpose, there are a lot of tools that not only extract, transform, and load data but also visualize the insights in a meaningful way so that corporations can make decisions based on insights. Microsoft Power BI is the tool which majorly used in almost all corporations.
Why only Power BI?
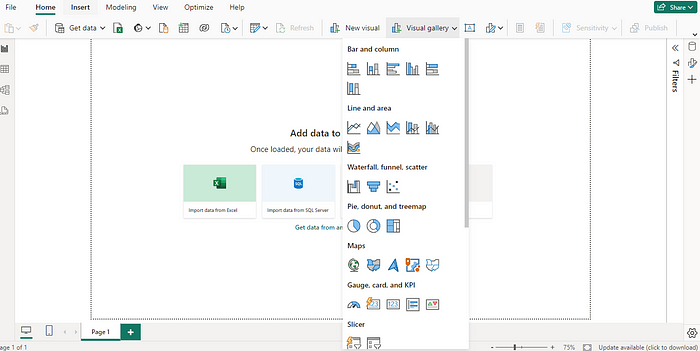
Power BI provides a lot of options to visualize the data, it has a wide variety of graphs starting from simple pie charts to more complex treemaps. It requires no coding, most of the time you would drag and drop the visualizations. A person with little or no technical background can learn it with less difficulty.
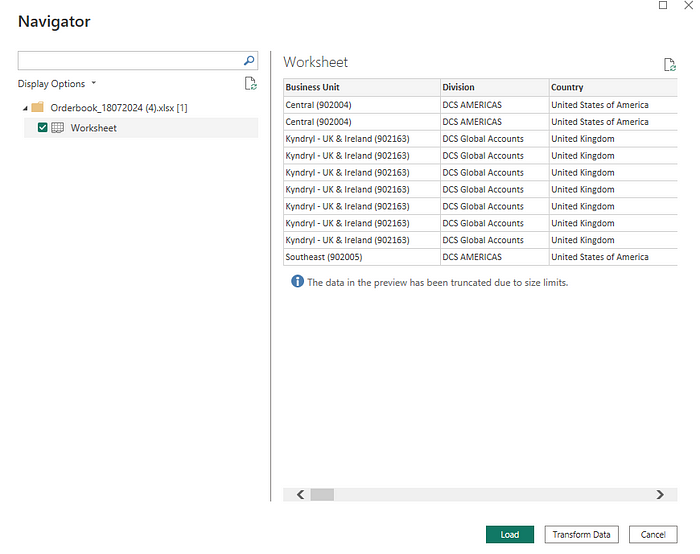
Data Extraction
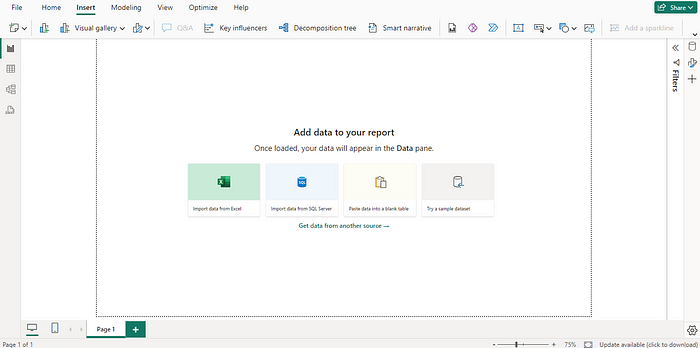
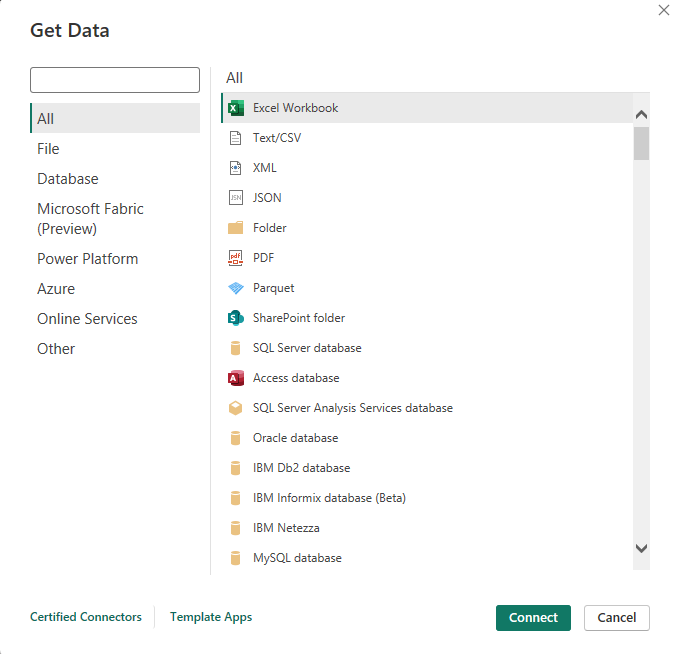
You can extract data from wherever you want. It provides almost all options such as Excelsheet, MySQL, SQL Server, PostgreSQL, etc. You just need to provide the localhost server address if you want to connect it to the database.
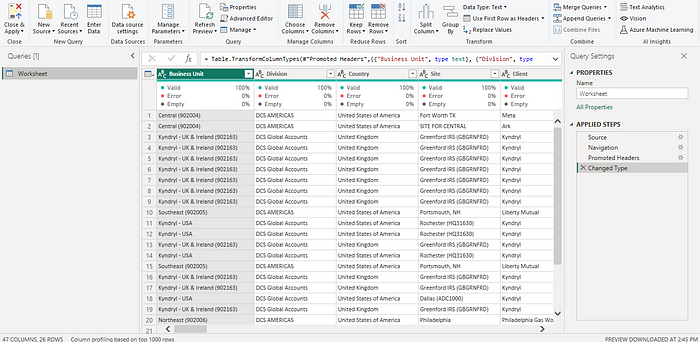
Data Transformation
Transformation of Data is the most critical part of ETL (Extract, Transform, Load). After extracting the data and loading it into your Power BI desktop, Power BI provides you the option of Transform. By clicking the “Transform Data” button, a new window pops up which is called “Query Editor”. You may also skip the transform process and directly jump to load data if you like.
Query Editor
Query Editor is a whole window that includes almost all tools required to deal with data transformation. You can remove duplications and null values, change the data types, remove rows and columns, perform various calculations, etc. The best thing is that whenever you are creating a dashboard and in parallel you create changes in Query Editors, those changes will automatically be loaded into the dashboard.
Components of the Power BI
There are three components that you should need to learn to master the Power BI:
- Report View
- Table View
- Model View
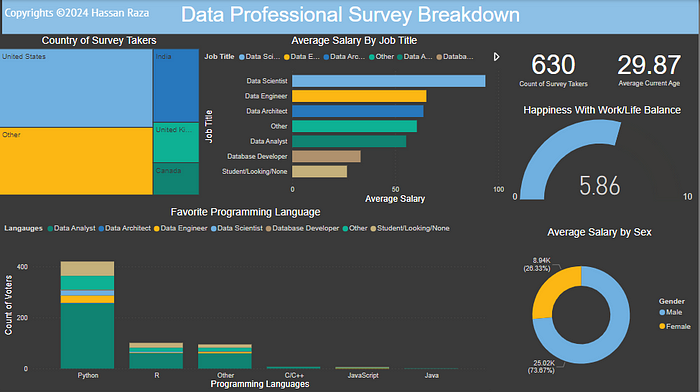
1. Report View
In Report View, you create your dashboard using various visualizations and graphs. Power BI provides you with various options like Pie charts, Line and stacked column charts, area charts, Maps, KPIs, etc. You not only insert visualizations but also format them according to your creativity and choice. You can also perform DAX calculations to add the measurements.
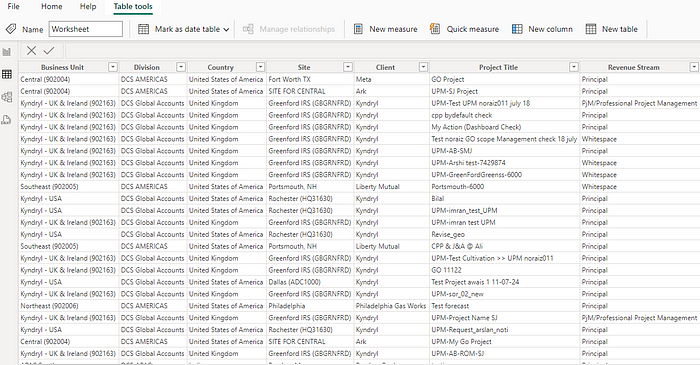
2. Table View
To view and change the data types of your columns, Table View provides you the options for that. Also, you can have multiple new columns and measurements.
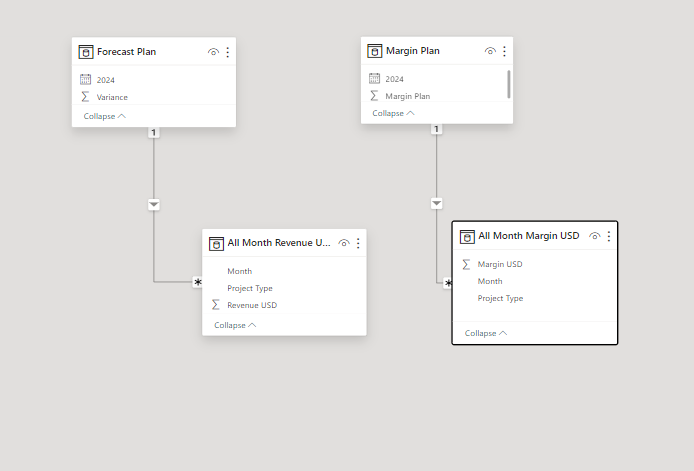
3. Model View
The model view is for creating the relations between the tables. It allows you to create a primary key, through primary keys you can create foreign keys as well. Relating columns in one table to another provides you the flexibility to use data in the dashboard when you are dealing with multiple tables.
Reference: