Microsoft is announcing a feature which will provide a new guided authoring experience in SharePoint Online/Microsoft Lists that will make it easy to quickly create business intelligence reports in Power BI using your list schema and data.
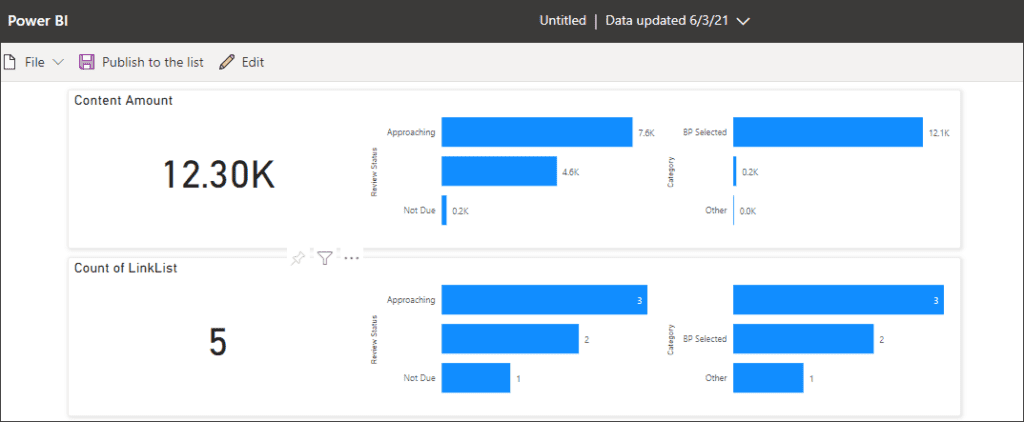
Using this feature you can visualize your list in Power BI. This is a new view and author experience that auto-generates an initial report for you based on the information in your list. You can specify fields to create from, or update the visuals shown in the report.
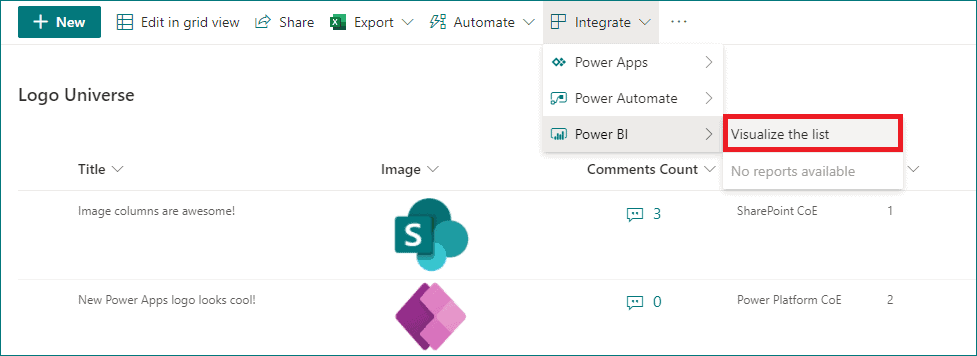
If you want more advanced report authoring capabilities, you can move into Edit mode and further refine. To create a report from a list, click the Integrate menu, choose Power BI and then you will see “Visualize the list”.
Key points
- Microsoft 365 Roadmap ID 72175
- Timing:
- Targeted Release: rolling out in early May
- Standard Release: rolling out from early June (previously late May) to mid-July (previously early June)
- Roll-out: tenant level
- Control type: admin control
- Action: review and assess
How this will affect your organization
List users will see a new menu option in Integrate > Power BI > Visualize this list, which allows users to create a new Power BI report using that list.
With just one click, you’ll be able to autogenerate a basic report and customize the list columns that are shown in the report. To take further advantage of Power BI’s advanced data visualization capabilities, just go into Edit mode. Once a report is saved and published, it will appear in the same submenu under Integrate> Power BI.
Notes
- Users with a Microsoft 365 E5 license or Power BI Pro license will have access to the full report authoring and viewing experience.
- Users without either of the above licenses will be prompted by Power BI to sign up for a 60-day free trial of Power BI Pro when they attempt to save a new report or edit/view an existing report. To turn off self-service sign-up so that the option for a trial is not exposed to List users, click here.
- Users with a Power BI free license may only visualize their list data, but cannot publish or view reports.
What you need to do to prepare
This feature is ON by default, but can be turned off from the Power BI Admin Portal under Tenant settings.
If this feature is disabled for tenants, users will continue to see the Power BI submenu in the List command bar, but any attempt to create or view a report will result in an error page.
Note
Certain complex column types in Lists such as Person, Location, Rich Text, Multi-select Choice, and Image are not currently supported when the Power BI report is autogenerated.
Learn more
- View and manage Power BI user licenses
- Get started creating in the Power BI service
- Quickly create reports in the Power BI service
- Enable or disable self-service sign-up and purchasing
This blog is part of SharePoint Week. For more great content, click here
Ganesh Sanap is a Software Engineer having expertise in SharePoint, Microsoft 365, Power Platform and Azure Development.
He is an active contributor on SharePoint StackExchange, Microsoft Techcommunity and Power Platform community as he likes to help the community. He likes to stay up to date with newly released and coming features in Microsoft 365 and Azure Services.
He is a Microsoft Certified Professional holding certifications on Microsoft 365, Power Platform and Microsoft Azure AI.
Currently he is mainly focused on SharePoint Framework, Power Platform and Azure AI development.
Reference:
Sanap, G. (2021). SharePoint JSON formatting: Check if date & time column is blank/empty. Available at: https://ganeshsanapblogs.wordpress.com/2021/06/20/sharepoint-json-formatting-check-if-date-and-time-column-is-blank-empty/ [Accessed: 30th August 2021].

